Bristol Research Initiative for the Dynamic Global
Environment
with the
University of Reading, Open University, and the British Antarctic Survey.
Model Simulations
Experiment: tcyxc
A long description of this run is currently not available
Brief Description
Fuller Description
Total Length of Run (in years)
Averaging period (in years)
Spinup period (in years)
CO2 (in ppmv)
CH4 (in ppbv)
N2O (in ppbv)
CFC11 (in pptv)
CFC12 (in pptv)
Computer used for simulation
Compiler used for simulation
Date of first entry in datebase
Date of most recent modification to entry in database
HadCM3M2.2_Benchmark
This job is stored in swsvalde and represents a BRIDGE standard HadCM3-MOSES2.2 job. It was run on bigblue on Aug 2010 and used 8 processors (4 NS/2 EW). The latter should not matter but has rarely been tested. We do not have a benchmark to compare this to but there is ambiguity as to whether fix_rad update should be included. This run does not include fix_rad and should be compared to tcyxb and the MOSES2.1 run tcywb.
600
30
570
280
760
270
0
0
bigblue
Intel_v10.1
2010_09_07_21_39
2010_09_07_21_39
You can access the means from this run, by going here
You can access the ocean integrals from this run, by going here
This page shows a small subset of images from this simulation. They have
already been produced and there are no optional choices. If you want to do a
more detailed examination of the model results, you can go to the
main page and select one of the Parts. This will give you full access the system
Summary of Results for Experiment tcyxc
Atlantic Meridional Overturning Strength
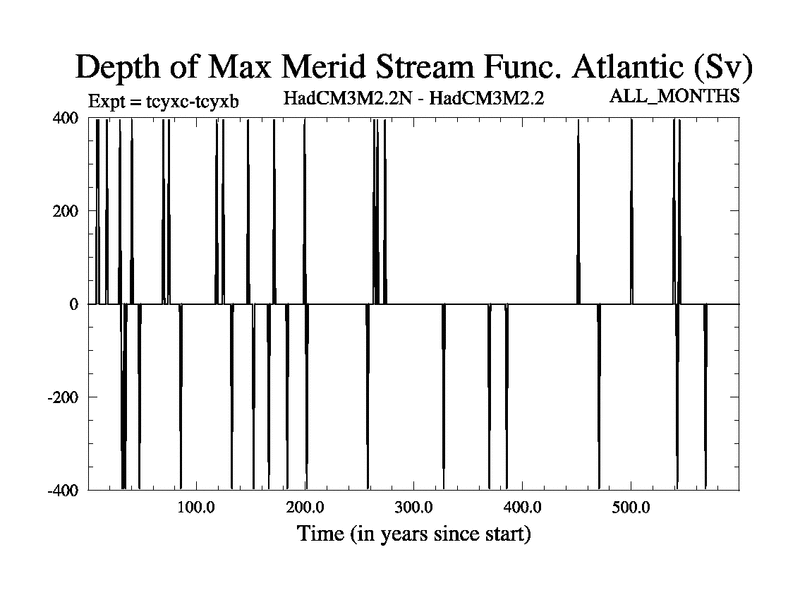
Depth of Max Atlantic Overturning
Latitude of Max Atlantic Overturning
Variable
DJF
JJA
ANN
Monthly
Variable
Surface Air Temperature
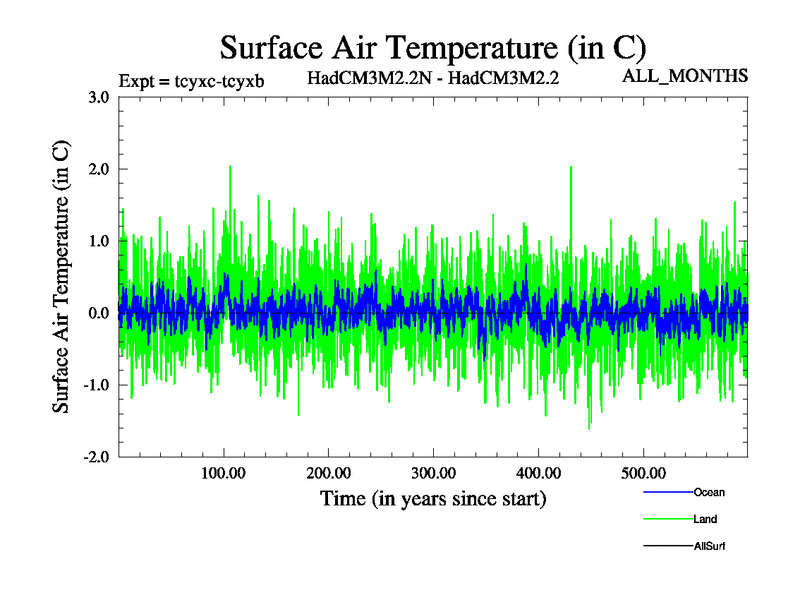
Surface Air Temperature Time Series
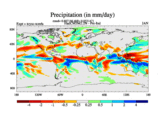
Total Precipitation
Surface Air Temperature Time Series (annual means)
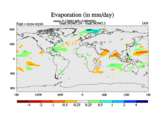
Evaporation
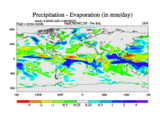
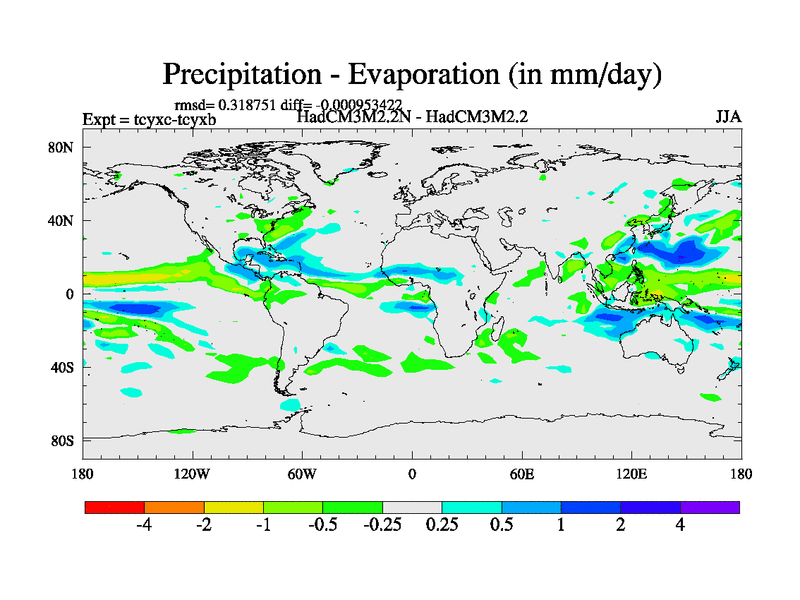
Precipitation - Evaporation
Gregory Plot (10 year running mean)
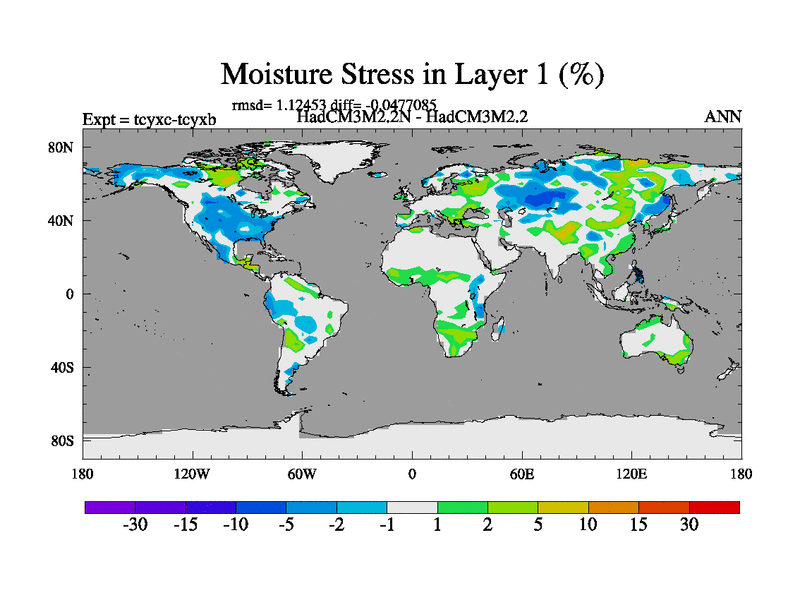
Fractional Plant Stress (layer 1)
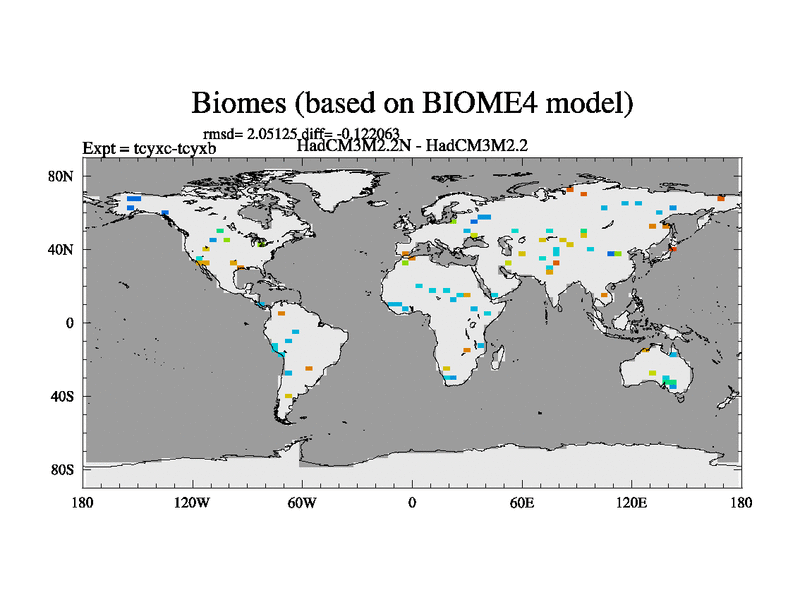
BIOME4
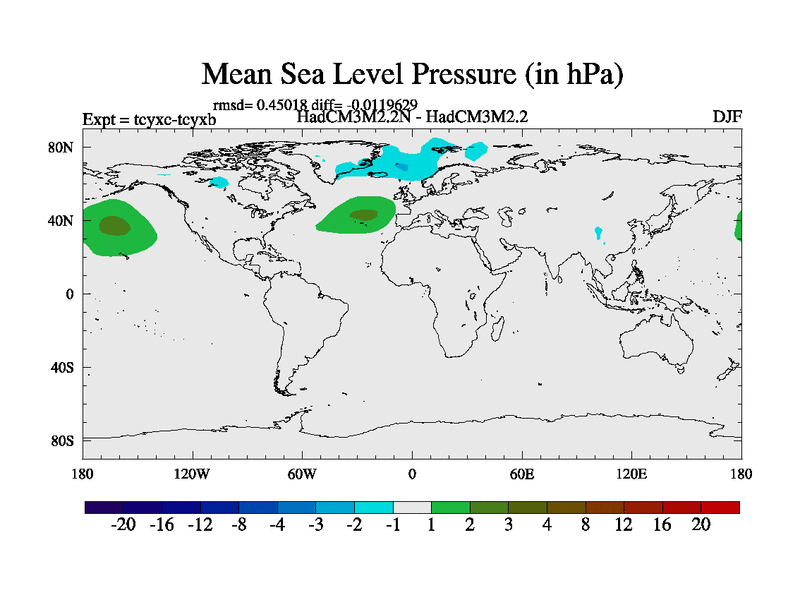
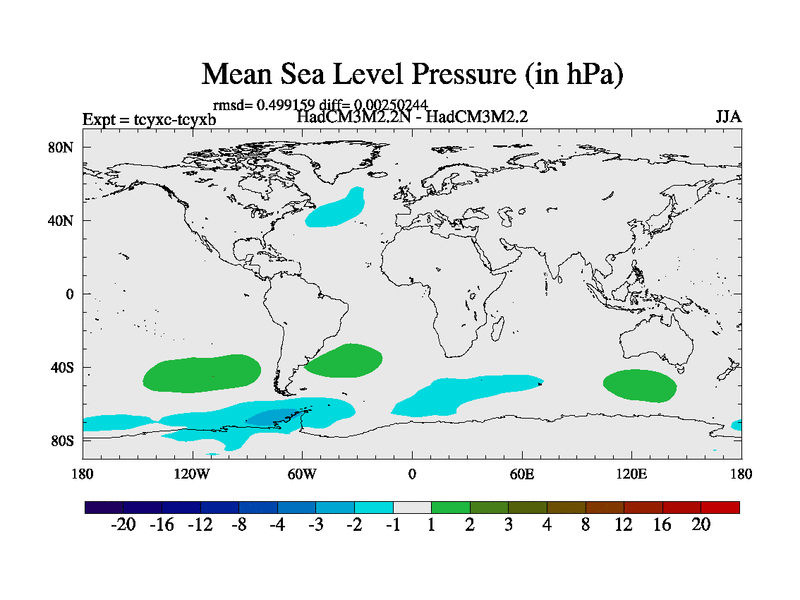
Mean Sea Level Pressure
BIOME4 with CO2 changed
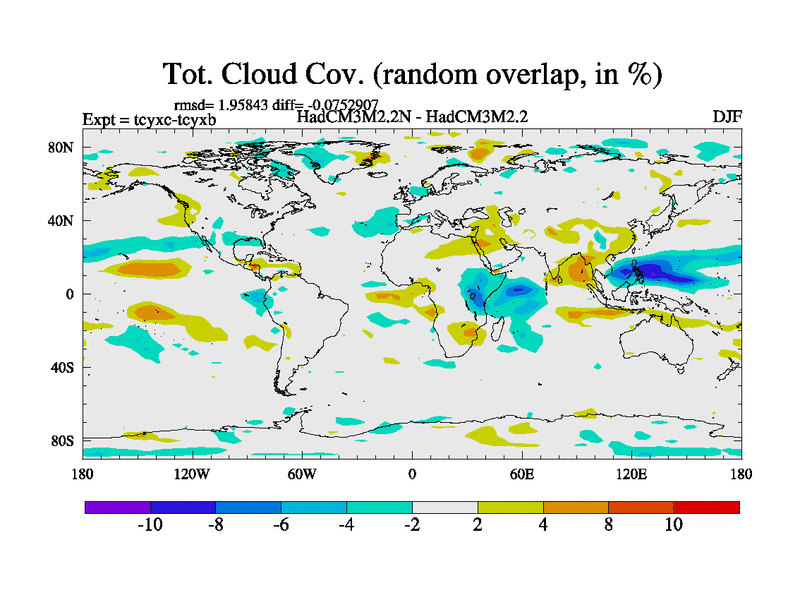
Total Cloud Cover
Plantary Albedo
Warm Month Mean
Surface Albedo
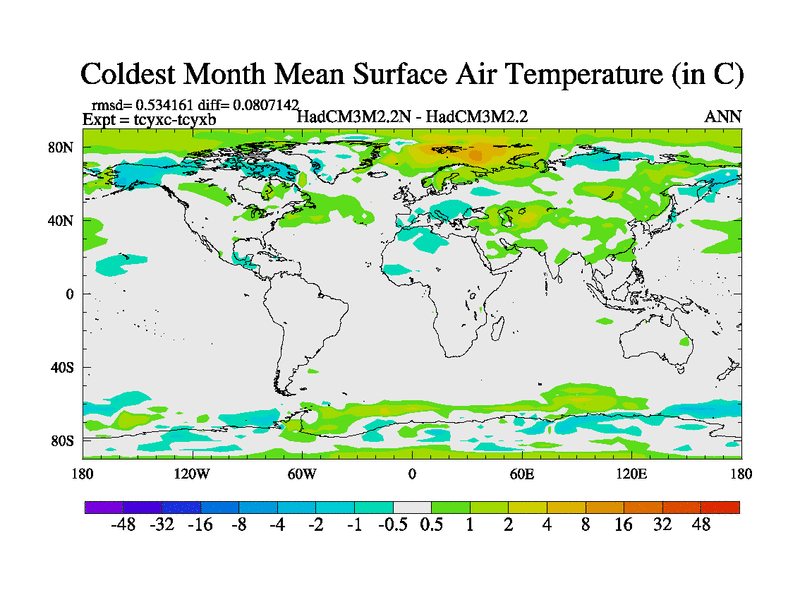
Cold Month Mean
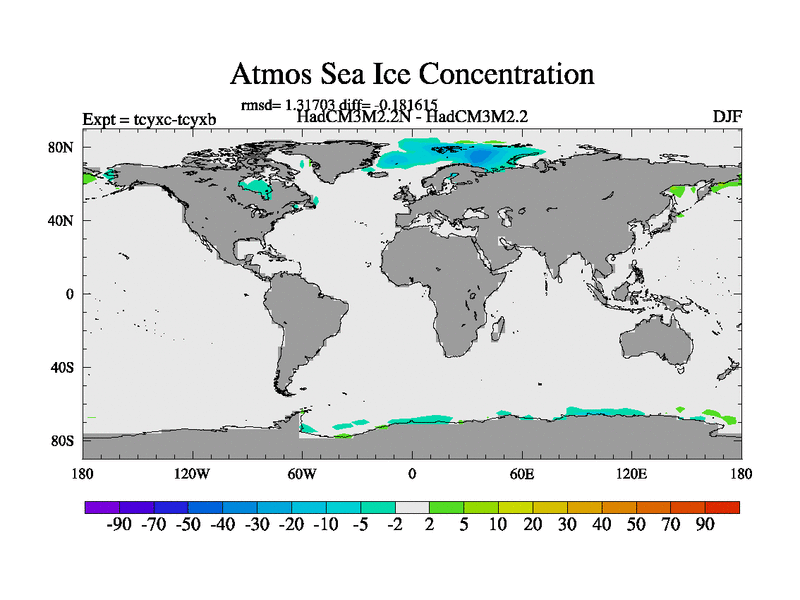
Sea Ice Concentration
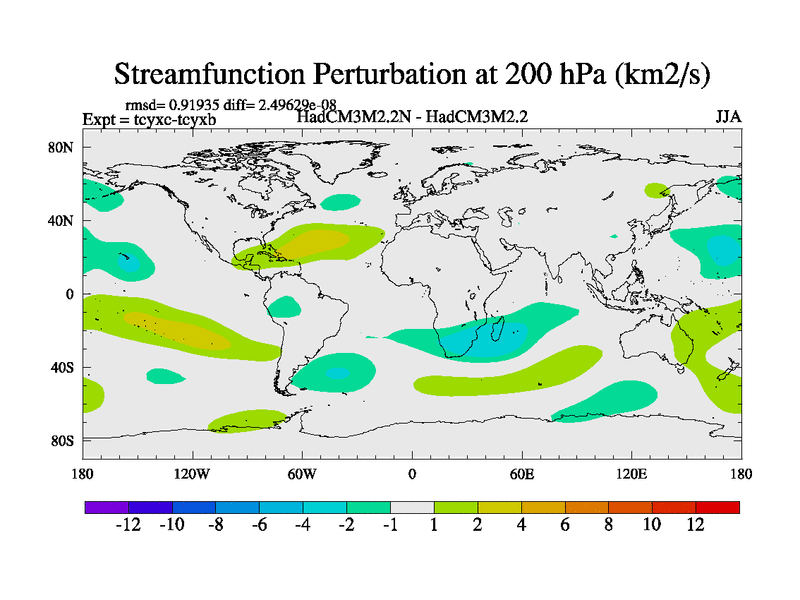
Stream Function at 200 hPa
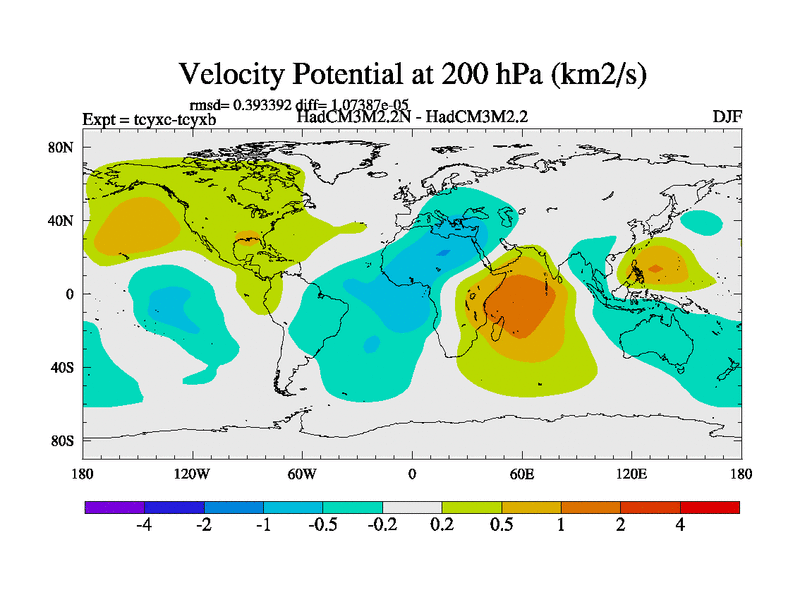
Velocity Potential at 200 hPa
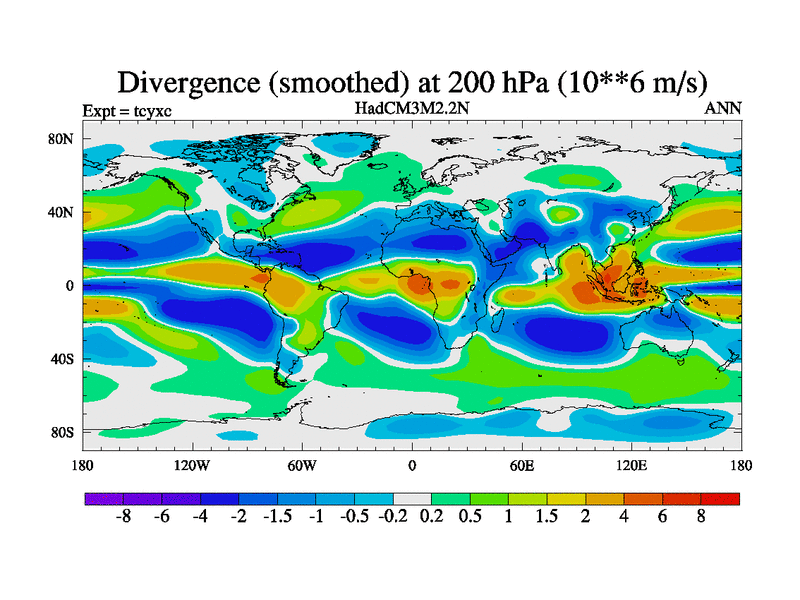
Divergence (Smoothed) at 200 hPa
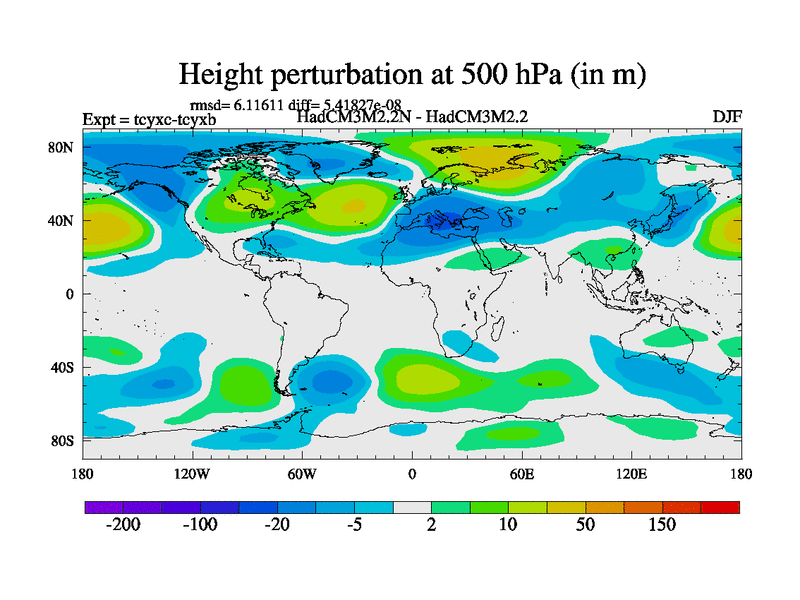
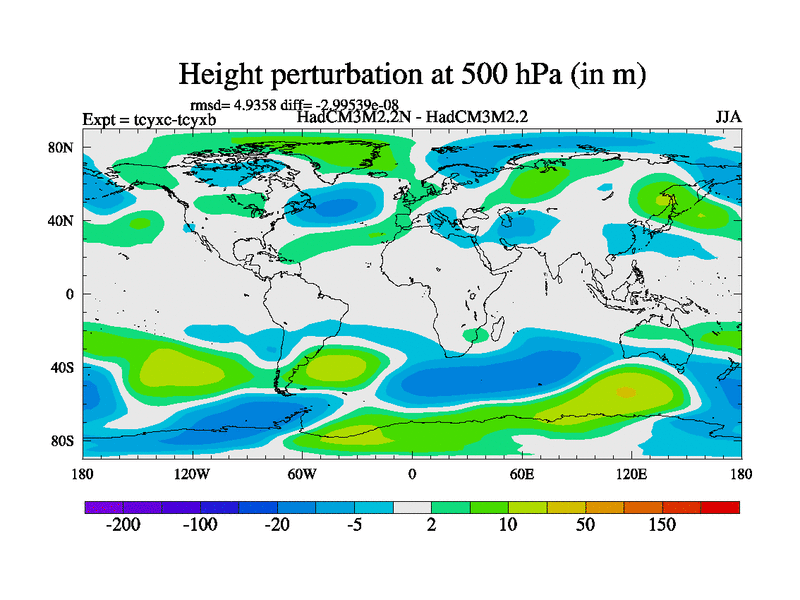
Perturbation Height at 500 hPa
Meridional Stream Function
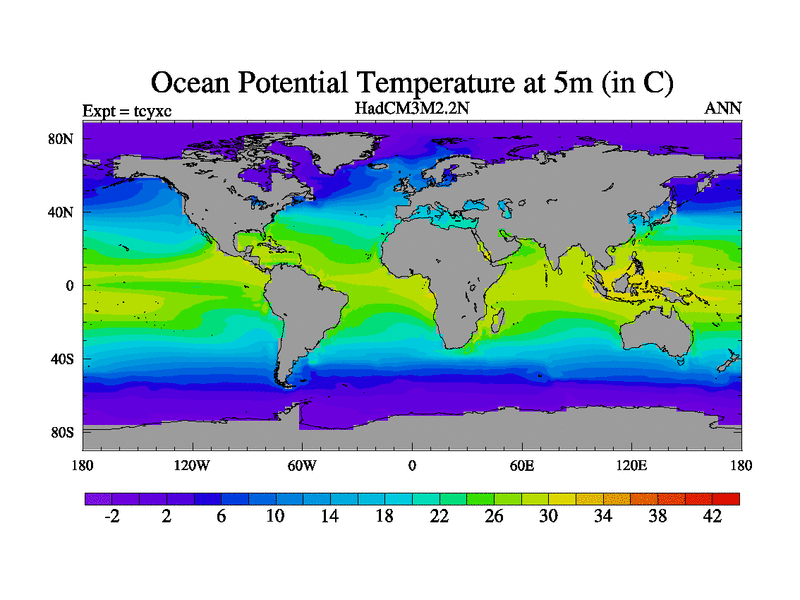
Ocean Potential Temperature at 5m
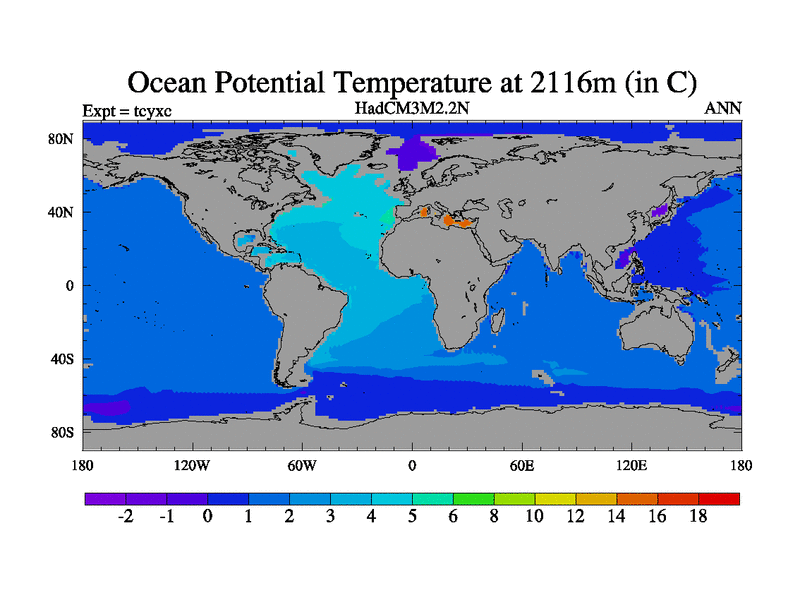
Ocean Potential Temperature at 2116m
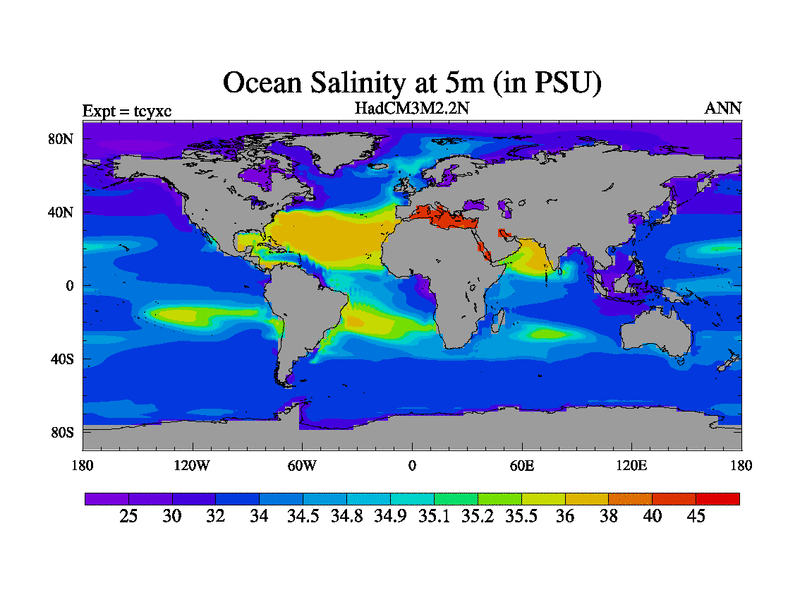
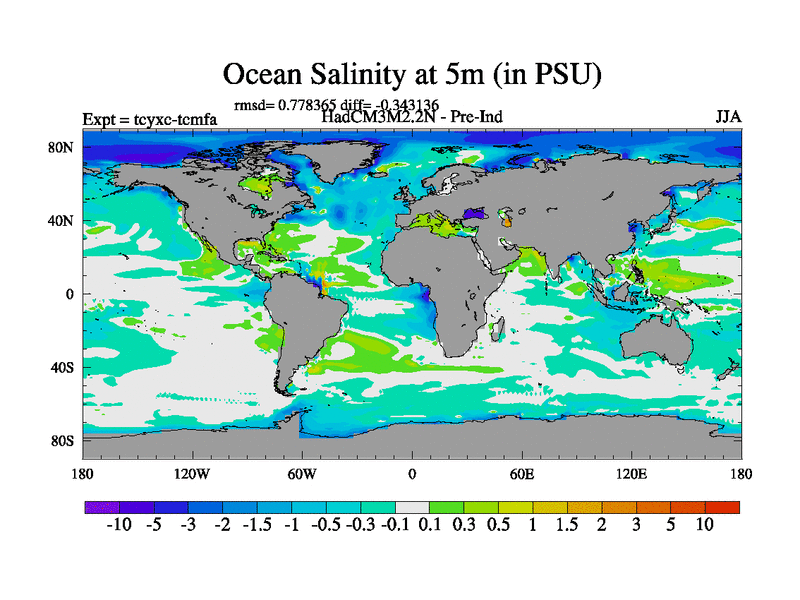
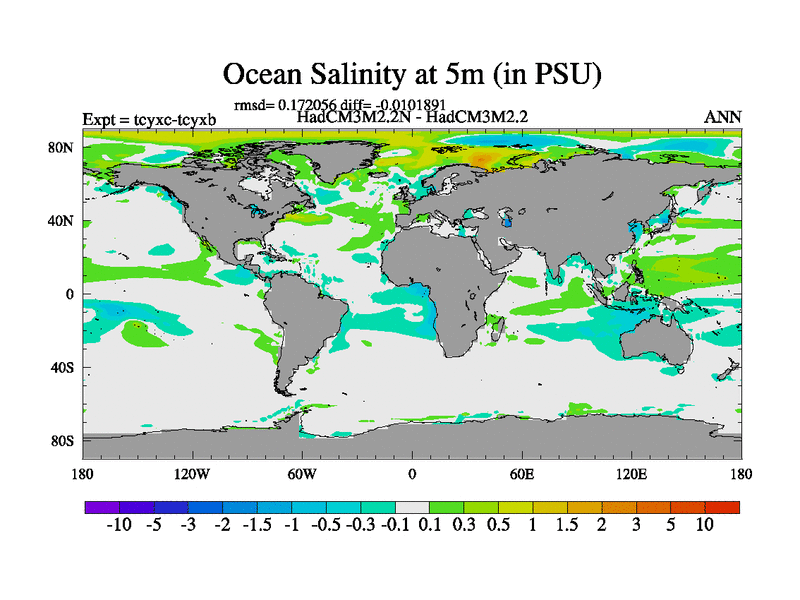
Ocean Salinity at 5m
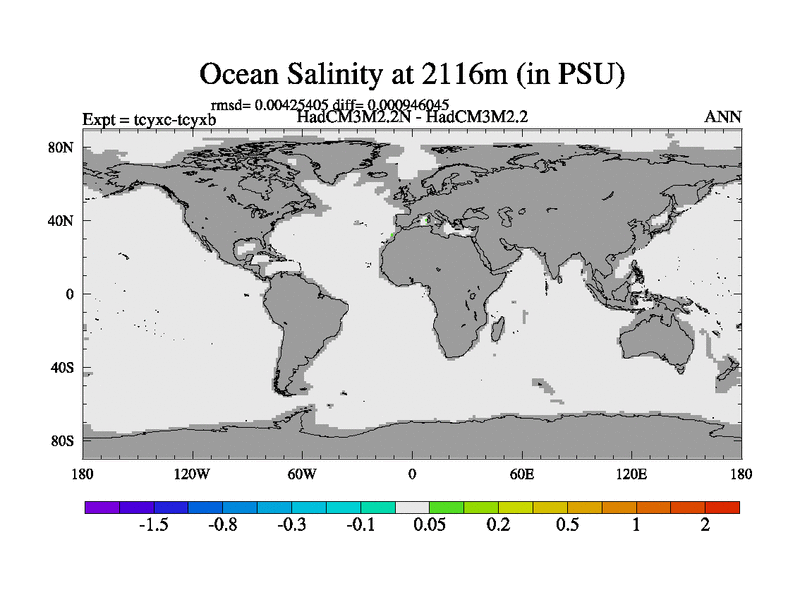
Ocean Salinity at 2116m
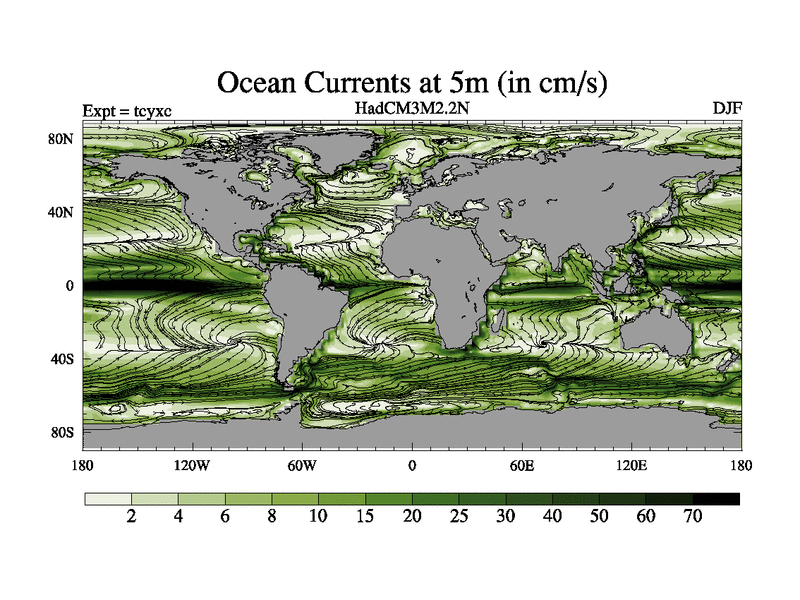
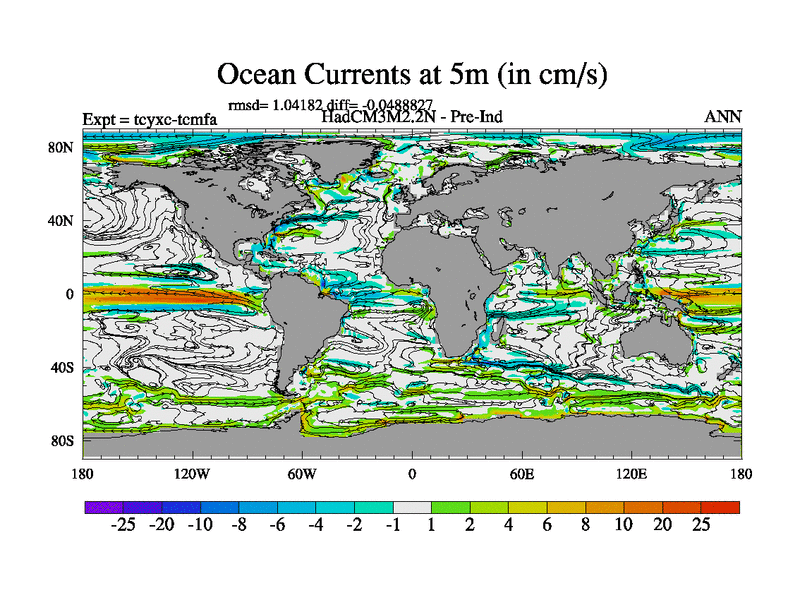
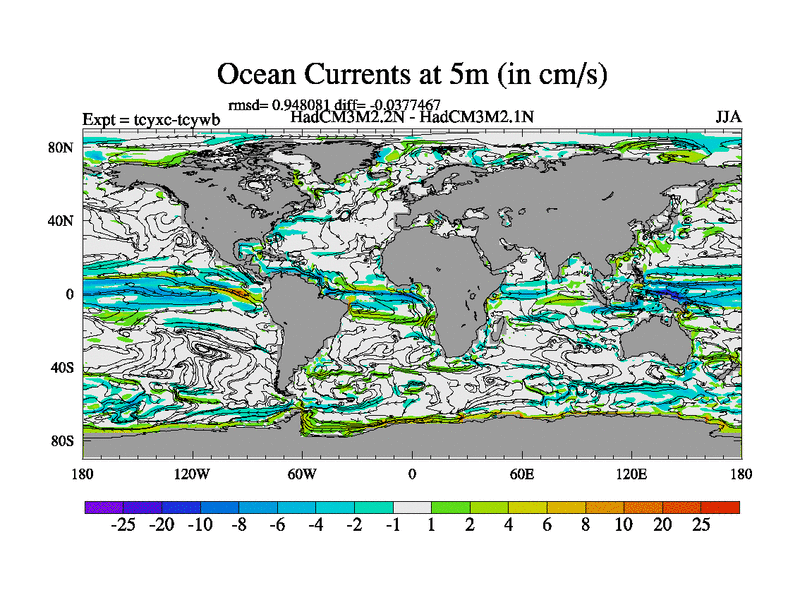
Ocean Currents at 5m
Ocean Currents at 2116m
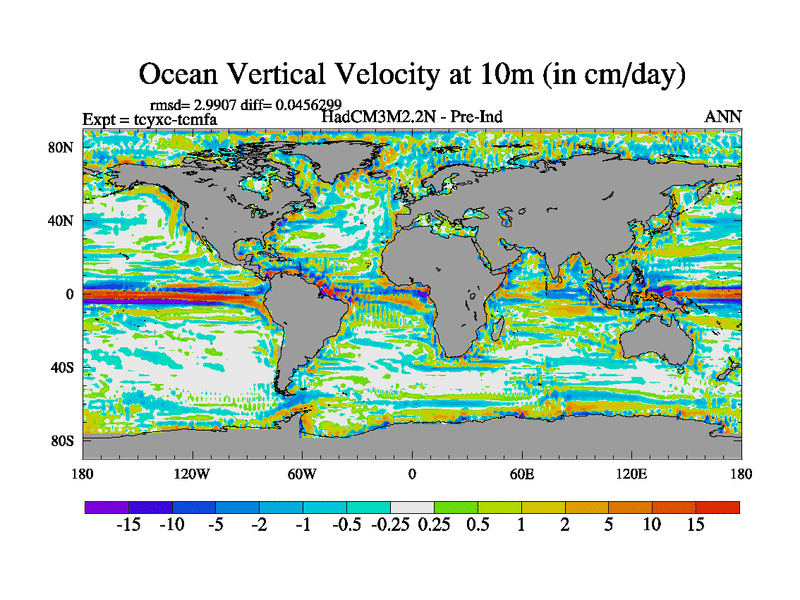
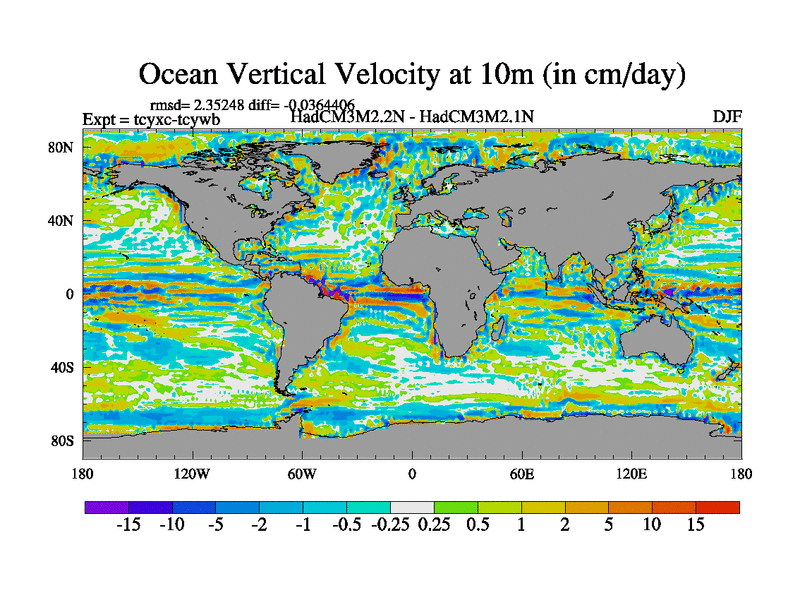
Ocean Vertical Velocity at 10m
Ocean Vertical Velicity at 2424m
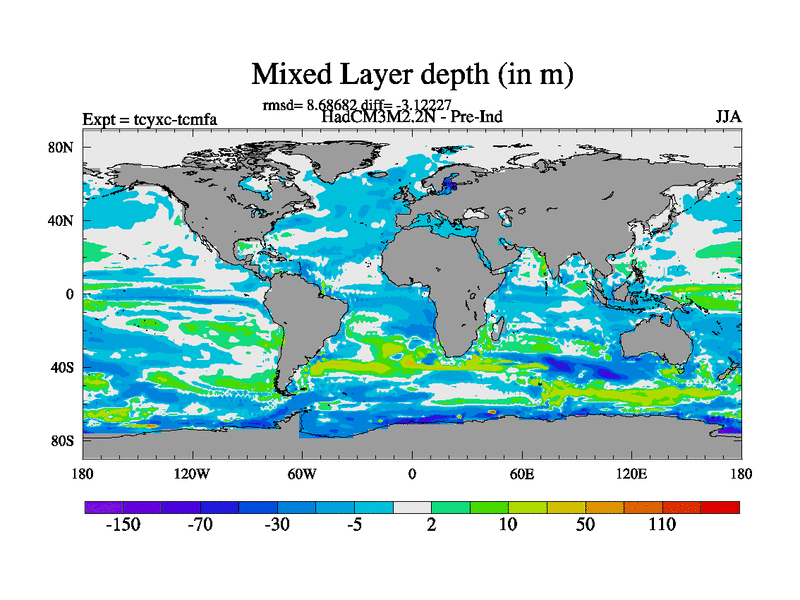
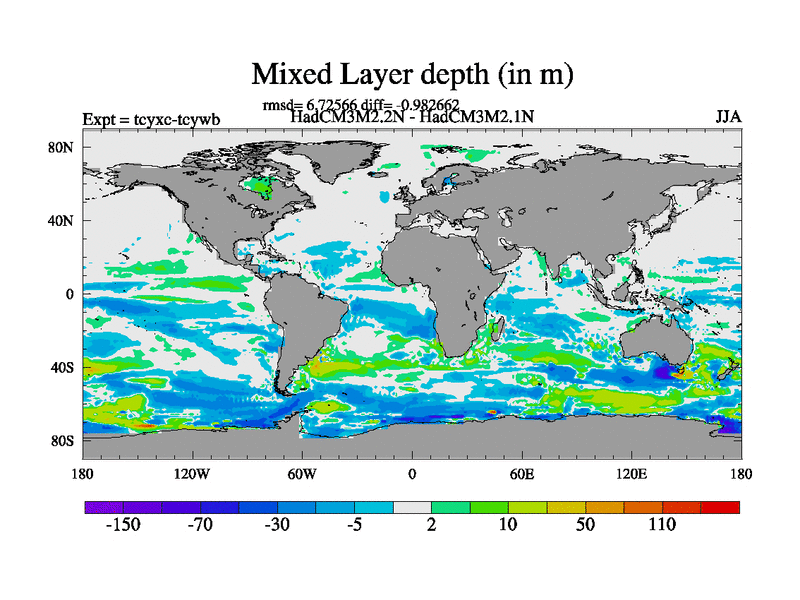
Ocean Mixed Layer Depth
Mass Streamfunction
Summary of Results for Experiment tcyxc-tcmfa
Variable
DJF
JJA
ANN
Monthly
Variable
Surface Air Temperature
Total Precipitation
Evaporation
Precipitation - Evaporation
Fractional Plant Stress (layer 1)
BIOME4
Mean Sea Level Pressure
BIOME4 with CO2 changed
Total Cloud Cover
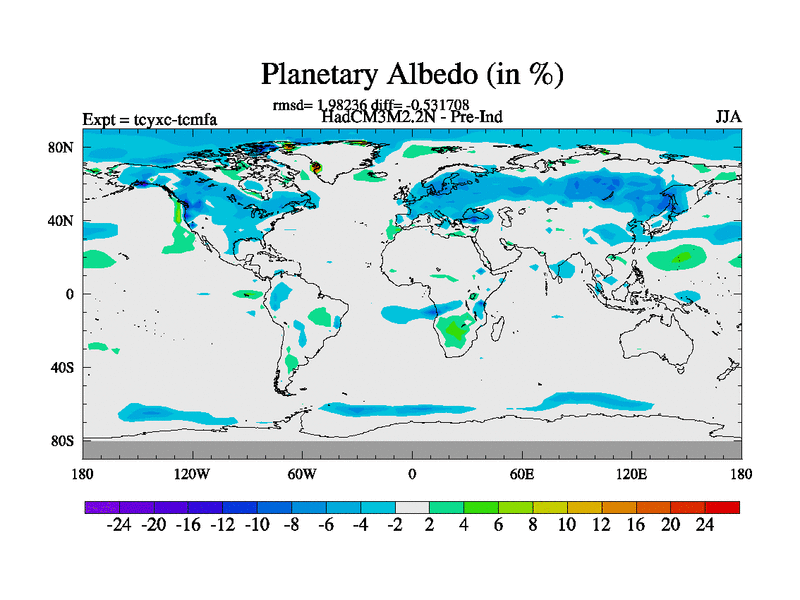
Plantary Albedo
Warm Month Mean
Surface Albedo
Cold Month Mean
Sea Ice Concentration
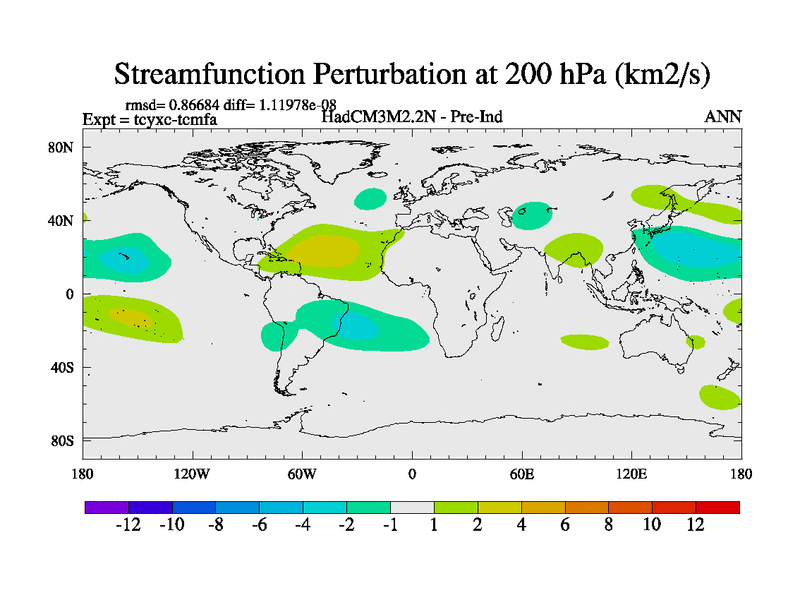
Stream Function at 200 hPa
Velocity Potential at 200 hPa
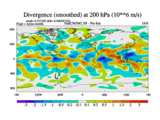
Divergence (Smoothed) at 200 hPa
Perturbation Height at 500 hPa
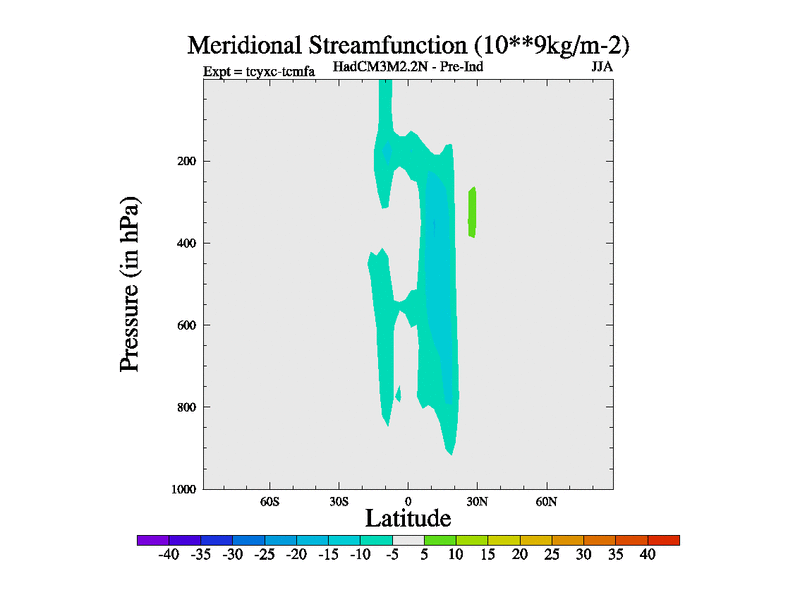
Meridional Stream Function
Ocean Potential Temperature at 5m
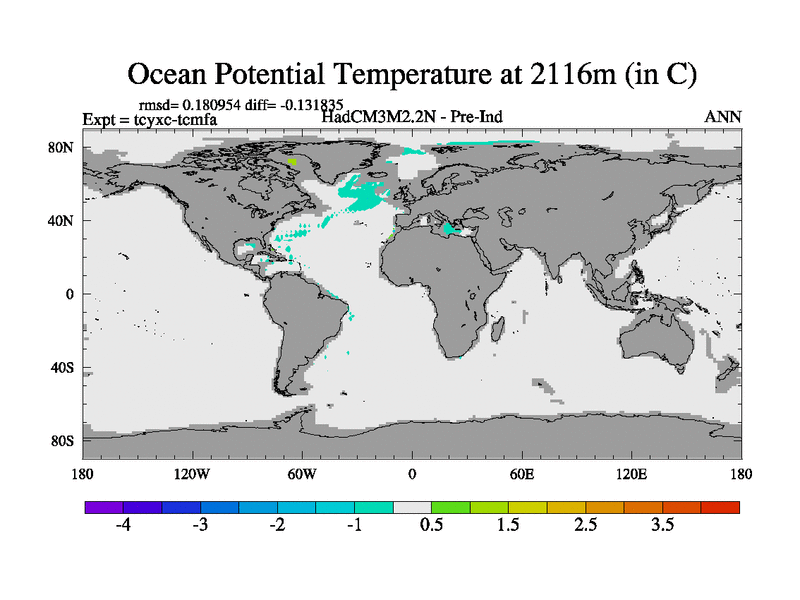
Ocean Potential Temperature at 2116m
Ocean Salinity at 5m
Ocean Salinity at 2116m
Ocean Currents at 5m
Ocean Currents at 2116m
Ocean Vertical Velocity at 10m
Ocean Vertical Velicity at 2424m
Ocean Mixed Layer Depth
Mass Streamfunction
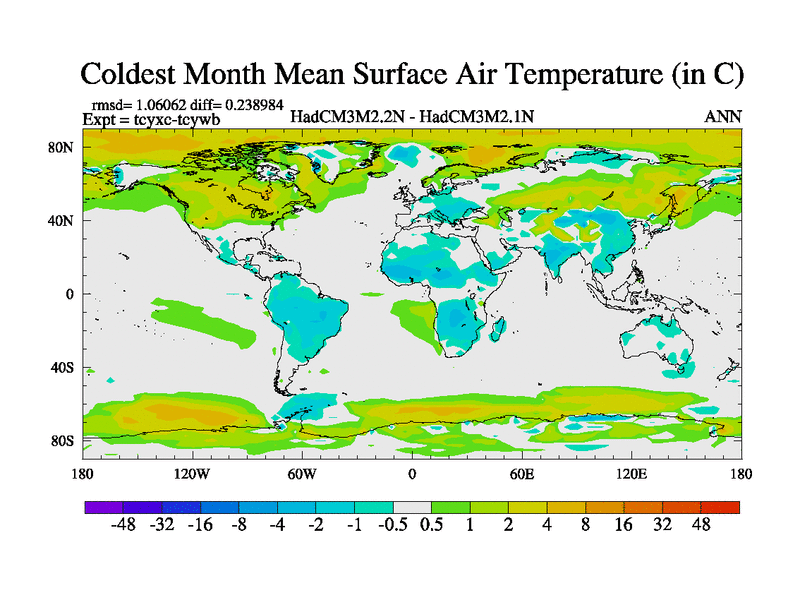
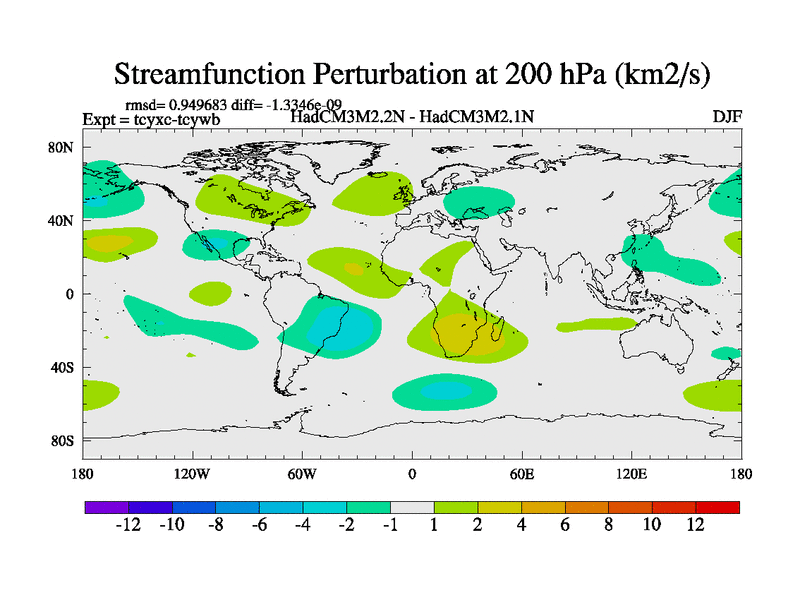
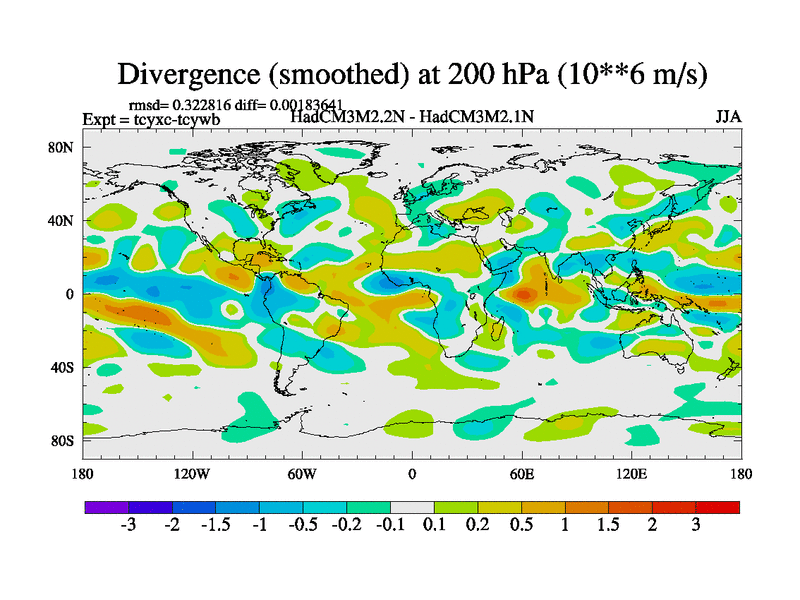
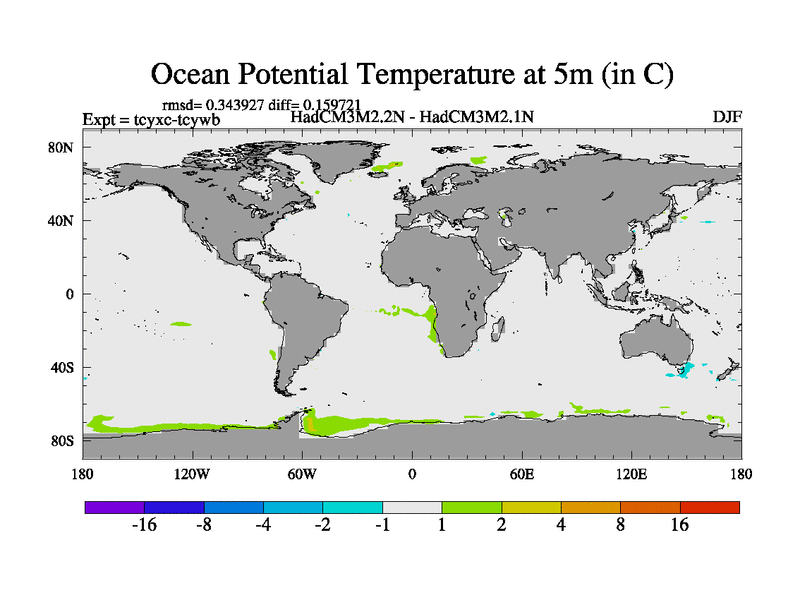
Summary of Results for Experiment tcyxc-tcywb
Atlantic Meridional Overturning Strength
Depth of Max Atlantic Overturning
Latitude of Max Atlantic Overturning
Variable
DJF
JJA
ANN
Monthly
Variable
Surface Air Temperature
Surface Air Temperature Time Series
Total Precipitation
Surface Air Temperature Time Series (annual means)
Evaporation
Precipitation - Evaporation
Fractional Plant Stress (layer 1)
BIOME4
Mean Sea Level Pressure
BIOME4 with CO2 changed
Total Cloud Cover
Plantary Albedo
Warm Month Mean
Surface Albedo
Cold Month Mean
Sea Ice Concentration
Stream Function at 200 hPa
Velocity Potential at 200 hPa
Divergence (Smoothed) at 200 hPa
Perturbation Height at 500 hPa
Meridional Stream Function
Ocean Potential Temperature at 5m
Ocean Potential Temperature at 2116m
Ocean Salinity at 5m
Ocean Salinity at 2116m
Ocean Currents at 5m
Ocean Currents at 2116m
Ocean Vertical Velocity at 10m
Ocean Vertical Velicity at 2424m
Ocean Mixed Layer Depth
Mass Streamfunction
Summary of Results for Experiment tcyxc-tcyxb
Atlantic Meridional Overturning Strength
Depth of Max Atlantic Overturning
Latitude of Max Atlantic Overturning
Variable
DJF
JJA
ANN
Monthly
Variable
Surface Air Temperature
Surface Air Temperature Time Series
Total Precipitation
Surface Air Temperature Time Series (annual means)